
LifeLabs vs. AIMLabs:
Why “Normal” On LifeLabs Doesn't Mean Optimal
Millions of Canadians visit LifeLabs across British Columbia and Ontario every year. You get your results on myresults™ / Excelleris, your doctor tells you “everything looks normal,” yet you still struggle with fatigue, brain fog, or stubborn gut issues. Here is how AIMLabs transforms standard LifeLabs blood work into deep bioindividual health intelligence.
See The Exact Same Blood Sample Analyzed
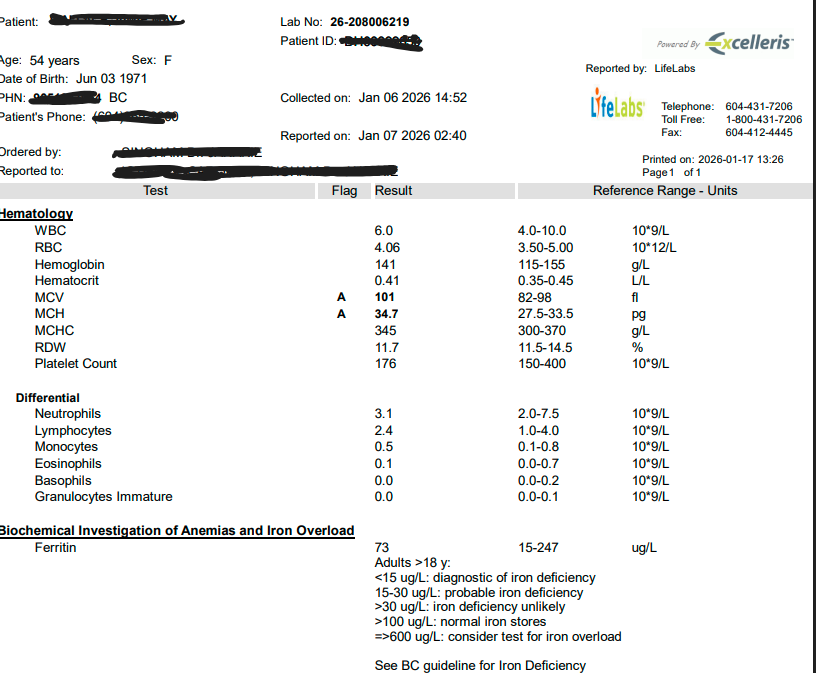
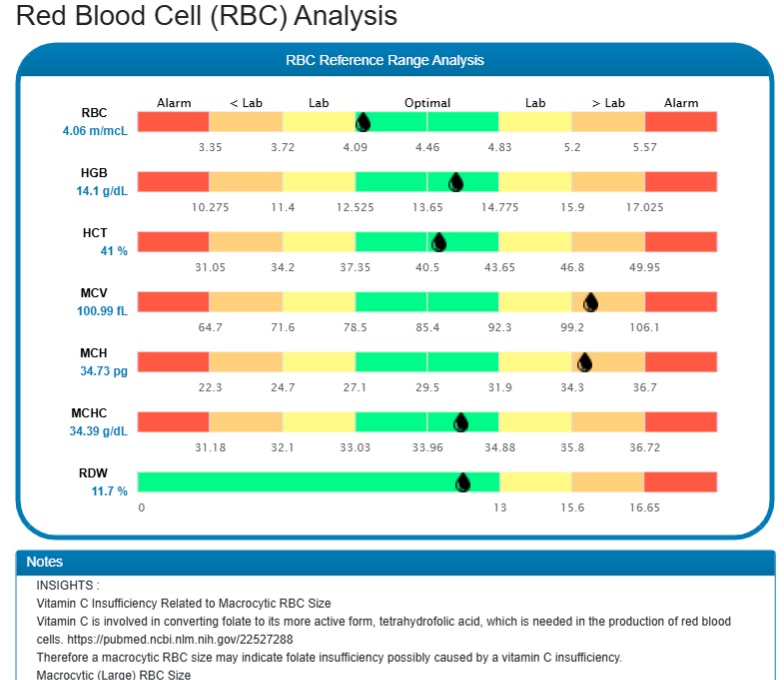
Click either report below to inspect the high-resolution evidence. Look at MCV (Mean Corpuscular Volume) and MCH — marked simply with a tiny “A” flag on LifeLabs with zero explanation, versus AIMLabs color-coded functional bell curve and targeted PubMed clinical insight.
1. Standard LifeLabs / Excelleris Report
Conventional Population Pathology Format
What LifeLabs Delivers:
- ✕Massive “Bell-Curve” Ranges: LifeLabs reference intervals are computed using 95% of whoever visited the lab — including sick, aged, or metabolically compromised individuals.
- ✕Cryptic “A” Flags with Zero Action Plan: MCV is flagged at 101 fl and MCH at 34.7 pg. No dietary recommendations, no root-cause exploration, no follow-up pathways provided.
- ✕Black & White Numbers Only: Fails to show where you sit along the trajectory toward clinical deficiency or inflammation.
2. AIMLabs Bioindividual Analysis
Functional 7-Zone Health Interpretation
What AIMLabs Delivers:
- ✓7-Zone Visual Spectrum: Clearly reveals whether you are Optimal (Green), Sub-optimal (Yellow), Warning (>Lab / <Lab), or in Alarm (Red).
- ✓PubMed Scientific Insights: Explains that elevated MCV (Macrocytic RBC) signals Vitamin C or Folate conversion insufficiency (linking directly to clinical research: pubmed.ncbi.nlm.nih.gov/22527288).
- ✓Actionable 1-on-1 Coaching: 45-60 minute consult with Coach Aimie Wallace to translate your report into tailored nutrition and lifestyle protocol.
Already have a LifeLabs or Dynacare lab report from your doctor?
Don't leave your results sitting in your online portal. Forward your existing PDF to AIMLabs for full 126 biomarker functional interpretation.
Drag to See Why “Normal” Isn't Optimal
Slide the marker along the scale. The broad grey bar is the LifeLabs population reference interval — the narrow green band is the AIMLabs optimal zone. Notice how many values LifeLabs calls “normal” actually sit far outside true optimal health.
Select a Biomarker
Ferritin (Iron Stores)
Current reading: 95 µg/L
Hair loss, chronic fatigue, restless legs, cold intolerance, brain fog.
Sustained energy, healthy hair growth, efficient oxygen transport and thyroid conversion.
Inflammation, iron overload (hemochromatosis risk), oxidative liver stress.
This value sits inside the AIMLabs optimal zone. Yet on a standard LifeLabs report, anything between 15 and 500 µg/L is simply flagged “normal” — including values far from optimal.
LifeLabs vs. AIMLabs at a Glance
How our functional interpretation bridges the gap between conventional lab testing and personalized preventative wellness.
| Evaluation Factor | LifeLabs / Provincial Labs | AIMLabs Bioindividual Agency |
|---|---|---|
| Primary Objective | Identify established acute disease or pathology requiring prescription drugs or surgery. | Early pattern recognition, optimal preventative health, and root-cause symptom resolution. |
| Reference Ranges Used | Broad population-based statistics (2 standard deviations encompassing 95% of sick and healthy citizens). | Tight, evidence-based bioindividual optimal zones calibrated for peak energy and metabolic longevity. |
| Biomarkers Interpreted | Only the basic markers specifically ticked on your requisition (often 10–25 markers). | 126 Bioindividual Biomarkers, calculated ratios, nutrient conversions, and red blood cell dynamics. |
| Report Formatting | Cryptic numbers and letters on PDF (e.g. “Flag: A”) with zero explanation of what caused it. | Visual 7-zone color charts (Optimal Green, Cautionary Yellow, Red Alarm) with clickable citations. |
| Scientific Citations | None. Patient must guess or search internet forums. | Direct PubMed references cited for nutrient pathways (e.g. Folate & Vitamin C correlation in macrocytosis). |
| Practitioner Review Time | Average 3–5 minute rushed doctor phone call (“Everything looks fine, no action needed”). | Dedicated 45–60 minute deep-dive consultation with Coach Aimie Wallace included with your report. |
| Actionable Action Plan | None unless a marker is critically out of range for medical intervention. | Comprehensive, individualized nutrition, targeted supplement protocols, and lifestyle adjustments. |
How to Get the Most Out of Your LifeLabs Blood Tests
Whether you just completed blood work at a LifeLabs Patient Service Centre in Vancouver, Surrey, Burnaby, Toronto, or Ottawa, here are the vital facts Canadian patients must know about their lab reports.
1. How to Download Your LifeLabs PDF
Log into your provincial portal (myresults™ for Ontario and Saskatchewan, or Excelleris LaunchPad for British Columbia). Navigate to your latest test results and select “Print / Download Official PDF Report.”
2. Upload to AIMLabs For Analysis
Submit your LifeLabs PDF directly to our secure portal. Our system processes all hematology, metabolic, thyroid, liver enzymes, and lipid panels through our 126 bioindividual functional algorithm.
3. Consult With Coach Aimie Wallace
Meet via private video consultation to walk through your 7-zone report. Learn exactly what foods, targeted micronutrients, and lifestyle tweaks will shift your borderline markers back into peak green zones.
Frequently Asked Questions About LifeLabs & AIMLabs
Do I need a doctor's referral to use AIMLabs?
No doctor referral is required. If you already had routine blood tests completed through LifeLabs, Dynacare, or hospital outpatient labs within the past 12 months, you can simply upload your PDF report directly to AIMLabs.
Why did my doctor say my LifeLabs results are “normal”?
Conventional physicians are trained to flag acute disease diagnoses (e.g. kidney failure, severe anemia, diabetes). If your markers are anywhere inside the broad 95% bell curve, it is labeled “normal,” even if you are on the very cusp of a chronic deficiency or inflammatory cascade.
Can AIMLabs analyze older LifeLabs test reports?
Yes! While tests from the last 6 months reflect your present physiological state, we frequently analyze previous years of LifeLabs history to chart your multi-year biological trajectory and spot developing health trends.
What if my LifeLabs requisition didn't include all 126 markers?
AIMLabs extracts and cross-calculates every single marker provided on your panel (such as Complete Blood Count, Differential, Ferritin, Electrolytes, Liver enzymes). We also provide you with a recommended lab checklist to request from your doctor for your next LifeLabs appointment.
Turn Your Ordinary LifeLabs Report Into a Bioindividual Roadmap
Join hundreds of proactive Canadians who refuse to settle for vague “within normal limits” answers. Order your 126 biomarker analysis today.